
People in These Cities Rarely Go to the Doctor
When was the last time you received your annual physical? Chances are that it has been over a year, if not three or four. There are practical reasons that explain why many adults in the U.S. forgo their annual doctor’s visit. For example, one study found that in 2016, 13 percent of adults in the U.S. did not visit their doctor because of cost. On the other hand, psychological factors are another likely culprit—because Americans are generally healthier now than in the past, many people (especially young people) feel that there is less of a need for general checkups.
To the contrary, advances in medicine and the subsequent improvement in overall health is why we should all make time for our annual physicals. Screening tests conducted during these exams can identify problems before they start or early on when the chances of effective treatment are highest. It’s because of this that routine doctor’s visits should be a key component of maintaining a healthy lifestyle. Instead, trends in the data suggest the opposite.
Every year, the Centers for Disease Control and Prevention (CDC) conducts a nation-wide telephone survey (the Behavioral Risk Surveillance Survey) to assess health and nutrition practices within the US. Data from this survey suggest that Americans leading less healthy lifestyles are more likely to go for their annual physical than Americans leading healthier lifestyles.
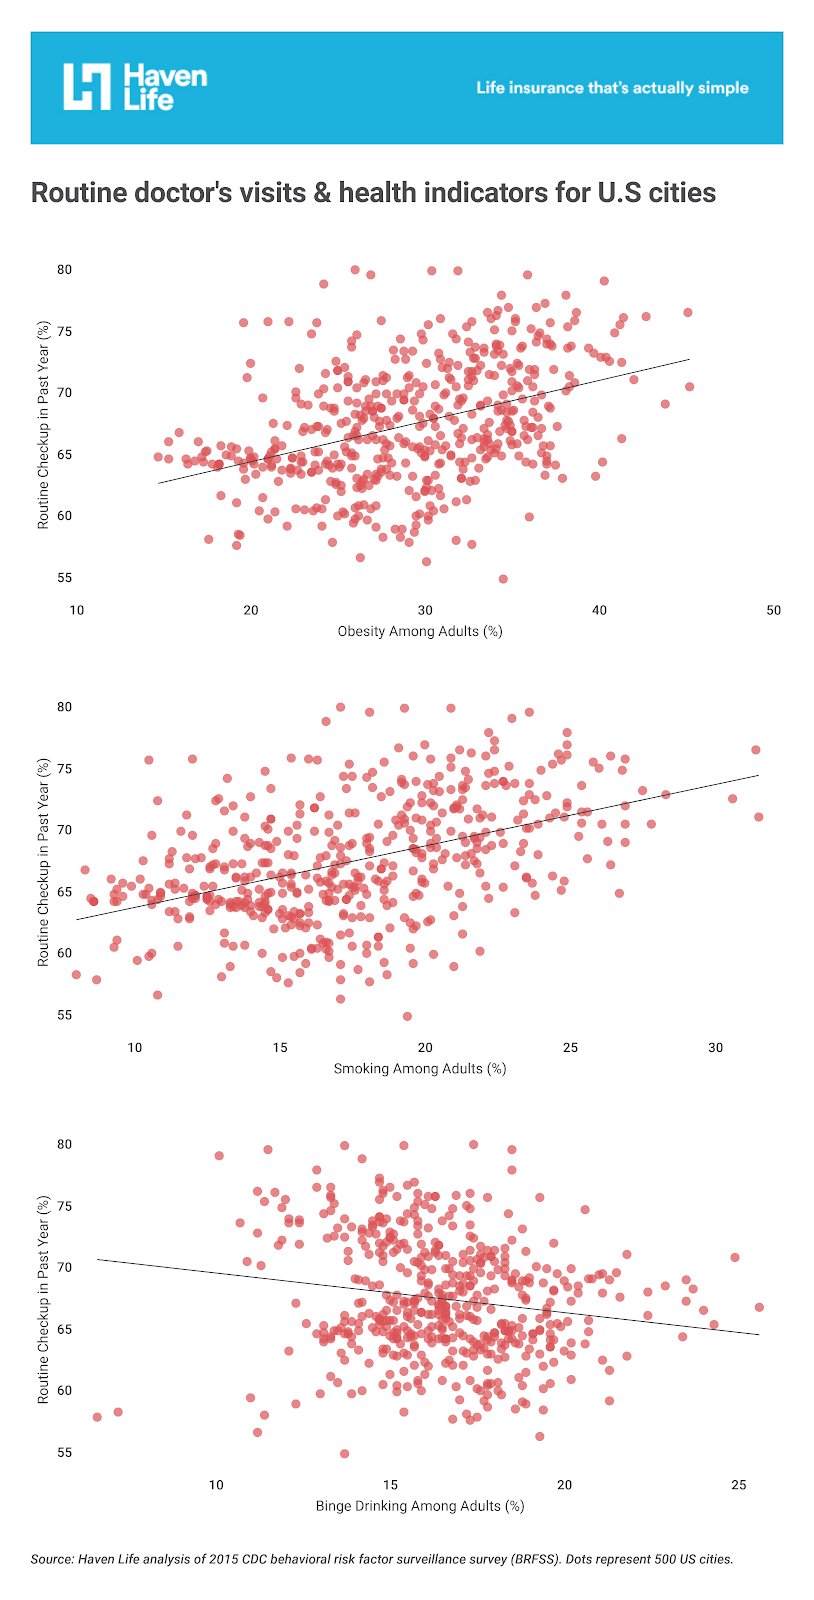
To better understand how visits to the doctor for routine checkups vary across the country, Haven Life, an online life insurance agency, analyzed data from the 500 Cities Project conducted in 2015, which is a collaboration between the Robert Wood Johnson Foundation and the CDC Foundation to help local health departments better focus public healthcare resources. Haven Life looked at the proportion of adults who visited the doctor for a routine checkup within the past year, in addition to other health and demographic factors. Here’s what they found.
Takeaways
- There was significant variation in the percent of adults who report having been to the doctor for a routine checkup within the last year. From a high of 80.6 percent to a low of 55.5 percent, the U.S. Average was 68.6 percent in 2015.
- Residents in the western United States—Utah, Colorado, Oregon, Alaska, and Idaho—were the least likely to have gone for a routine checkup with the last year.
- Obesity showed a slight positive correlation with routine doctor visits. Resident in cities with higher obesity rates were more likely to go for their annual checkup. Across the entire U.S., the percent of adults who are obese was 28.7 percent.
- Smoking also showed a slight positive correlation with routine doctor visits. Residents in cities with higher smoking rates were also more likely to make their routine physical exam. Across the entire U.S., the percent of adults who smoke was 17.1 percent.
- Interestingly, unlike smoking and obesity rates, binge drinking showed a very slight negative correlation with such visits to the doctor. Cities with a lower proportion of its population going to the doctor for annual physicals were more likely to have higher rates of binge drinking. Across the entire U.S., the percent of adults who binge drink was 17.2 percent.
- Residents of more diverse cities tended to visit the doctor more regularly. The proportion of the population identifying as non-white (i.e. a minority) showed a slight positive correlation with routine doctor visits. Across the entire U.S., the percent of adults who identify as non-white was 26.4 percent.
- More affluent cities showed lower rates of routine doctor visits than less affluent cities. The proportion of the population below the poverty threshold, showed a slight positive correlation with routine doctor visits while median income showed a slight negative correlation. Across the entire U.S., the percent of adults below the poverty line was 15.5 percent, and the 2015 median income was $53,889.
Top ten cities that rarely go to the doctor
 Photo Credit: Joe Roper / Alamy Stock Photo
10 (Tied). Orem, UT
- Adults visiting a doctor for a routine check-up within the past year: 58.9%
- Obesity among adults: 27.6%
- Smoking among adults: 8.0%
- Binge drinking among adults: 7.2%
- Non-white population: 11.0%
- Poverty rate: 16.9%
- Median household income: $55,166
While less than 60 percent of Orem’s population visits their doctor for an annual routine checkup, the city’s population was generally healthier than the national average. Orem boasted below-average rates of both binge drinking, obesity and smoking in 2015. Consistent with the findings that cities with less diverse populations tend to have lower rates of doctor visits, only 11 percent of Orem residents identified as non-white, which is 15 percentage points below the national average.
 Photo Credit: Marek Uliasz / Alamy Stock Photo
10 (Tied). Greeley, CO
- Adults visiting a doctor for a routine check-up within the past year: 58.9%
- Obesity among adults: 28.6%
- Smoking among adults: 18.7%
- Binge drinking among adults: 15.4%
- Non-white population: 18.8%
- Poverty rate: 20.2%
- Median household income: $48,813
Tied in tenth place with Orem, UT, 58.9 percent of Greeley’s population visited their doctor for an annual physical within the past year. Greeley had approximately 20 percent of its population living below the poverty threshold, which is nearly 5 percentage points higher than the national average. Also consistent with the findings that cities with less diverse populations tend to have lower rates of annual physicals, approximately 19 percent of Greeley’s population identify as non-white, which is approximately 7 percentage points below the national average.
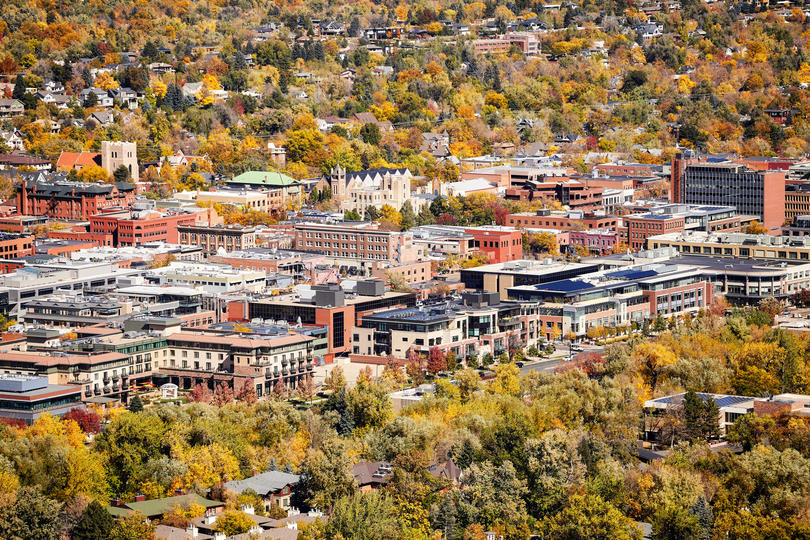 Photo Credit: Maciej Bledowski / Alamy Stock Photo
9. Boulder, CO
- Adults visiting a doctor for a routine check-up within the past year: 58.7%
- Obesity among adults: 17.6%
- Smoking among adults: 13.0%
- Binge drinking among adults: 17.2%
- Non-white population: 11.5%
- Poverty rate: 23.1%
- Median household income: $58,484
Like Orem, UT, with less than 60 percent of Boulder’s population getting their annual physical, the city’s population was overall healthier than the national average. Obesity rates were over 10 percentage points lower than the national average and smoking rates were four percentage points lower. Consistent with the finding that cities with a higher median income frequent their doctor less for annual physicals, Boulder’s median income was about $5,000 higher than the national average.
 Photo Credit: Witold Skrypczak / Alamy Stock Photo
8. Ogden, UT
- Adults visiting a doctor for a routine check-up within the past year: 58.6%
- Obesity among adults: 31.8%
- Smoking among adults: 14.9%
- Binge drinking among adults: 11.4%
- Non-white population: 17.6%
- Poverty rate: 22.9%
- Median household income: $41,036
Ogden also had less than 60 percent of its population going for their annual physical, ten percentage points lower than the national average. The city boasts a healthier lifestyle with respect to binge drinking and smoking, as the city’s rates in 2015 were close to six and two percentage points lower than the national average respectively. Also consistent with trends in poverty, Ogden’s proportion of the population under the poverty threshold was greater than the national average by more than seven percentage points.
 Photo Credit: Gary Gray / Alamy Stock Photo
6 (Tied). Thornton, CO
- Adults visiting a doctor for a routine check-up within the past year: 58.5%
- Obesity among adults: 24.7%
- Smoking among adults: 17.1%
- Binge drinking among adults: 17.5%
- Non-white population: 14.7%
- Poverty rate: 8.9%
- Median household income: $66,948
Though Thorton’s binge drinking, smoking, and obesity rates were very close to the national average, Thornton’s demographic factors were consistent with the trends identified in this study. Thorton’s poverty rate was approximately six and a half percentage points lower than the national average, and the percent of the population identifying as a minority (i.e. non-white) was far lower than the national average in 2015.
 Photo Credit: Aurora Photos / Alamy Stock Photo
6 (Tied). Provo, UT
- Adults visiting a doctor for a routine check-up within the past year: 58.5%
- Obesity among adults: 29.1%
- Smoking among adults: 8.7%
- Binge drinking among adults: 6.6%
- Non-white population: 11.8%
- Poverty rate: 28.8%
- Median household income: $41,291
In 2015, Provo’s binge drinking and smoking rates were much lower than the national average, reflecting trends that people with healthier lifestyles go for their annual physical less often. Also consistent with trends on demographic factors and going for an annual physical, Provo’s population was less diverse, with approximately 12 percent of its population identifying as non-white. This is close to 15 percentage points lower than the national average.
 Photo Credit: Nadia Yong / Alamy Stock Photo
5. Salem, OR
- Adults visiting a doctor for a routine check-up within the past year: 58.3%
- Obesity among adults: 32.7%
- Smoking among adults: 18.1%
- Binge drinking among adults: 16.8%
- Non-white population: 19.6%
- Poverty rate: 18.2%
- Median household income: $47,191
Like Thornton, CO, in 2015, Salem’s binge drinking, obesity, and smoking rates were very close to the national average. However, the percent of population identifying as non-white in Salem was almost seven percentage points lower than the national average, which is consistent with the trends showing that cities with a smaller minority population go for their annual physical less often.
 Photo Credit: George Ostertag / Alamy Stock Photo
4. Longmont, CO
- Adults visiting a doctor for a routine check-up within the past year: 58.2%
- Obesity among adults: 19.2%
- Smoking among adults: 15.3%
- Binge drinking among adults: 17.3%
- Non-white population: 14.4%
- Poverty rate: 14.1%
- Median household income: $62,208
While less than 60 percent of Longmont’s population visited their doctor for an annual routine visit in 2015, Longmont boasted lower obesity rates compared to the national average. Also consistent with the trends in cities with less diverse populations having lower rates of annual physicals, only 14 percent of Longmont residents identified as non-white in 2015, 12 percentage points below the 2015 national average. Median household income was also more than $8,000 above the national average, supporting the finding that cities with higher median incomes have lower rates of routine doctor’s visits.
 Photo Credit: Len Wilcox / Alamy Stock Photo
3. St. George, UT
- Adults visiting a doctor for a routine check-up within the past year: 57.2%
- Obesity among adults: 26.3%
- Smoking among adults: 10.8%
- Binge drinking among adults: 11.2%
- Non-white population: 9.7%
- Poverty rate: 16.0%
- Median household income: $49,614
In 2015, St. George’s binge drinking, obesity, and smoking rates were much lower than the national average: approximately six, two and six percentage points respectively, reflecting trends that people with healthier lifestyles go for their annual physical less often. Also consistent with trends on demographic factors and going for an annual physical, Provo’s population was less diverse, with just under 10 percent of its population identifying as non-white. This is close to a 17 percentage point difference from the national average.
 Photo Credit: RUBEN RAMOS / Alamy Stock Photo
2. Anchorage, AK
- Adults visiting a doctor for a routine check-up within the past year: 56.9%
- Obesity among adults: 30.1%
- Smoking among adults: 17.1%
- Binge drinking among adults: 19.3%
- Non-white population: 35.0%
- Poverty rate: 8.2%
- Median household income: $78,326
Compared to the other cities on this list, Anchorage was an outlier with respect to its cultural diversity. The city was the most culturally diverse of this list with 35 percent of residents identifying as non-white, nearly nine percentage points higher than the national average. Also different from the other cities on this list, Anchorage’s binge drinking, obesity, and smoking rates were similar to the national average in 2015, while the poverty rate was much lower and median income much higher.
 Photo Credit: Charles Knowles / Alamy Stock Photo
1. Nampa, ID
- Adults visiting a doctor for a routine check-up within the past year: 55.5%
- Obesity among adults: 34.5%
- Smoking among adults: 19.4%
- Binge drinking among adults: 13.7%
- Non-white population: 11.7%
- Poverty rate: 16.9%
- Median household income: $40,060
The city whose population went for their annual checkup the least in 2015 is Nampa. Like Anchorage, AK, Nampa was an outlier in this top ten list because although binge drinking rates were lower than the national average, obesity and smoking rates were both higher. Also, the poverty rate was slightly higher than the national average, and the median income was close to $14,000 less than the national average.
Methodology
Data assessing the following variables were collected from the Center for Disease Control’s analysis of the 2015 Behavioral Risk Factor Surveillance System annual telephone survey: number of visits to the doctor, binge drinking episodes, smoking rates, and obesity rates. All calculated means are age-adjusted for each city. Only the largest 500 U.S. cities were evaluated.
Data assessing the following variables were collected from the from the U.S. Census Bureau’s American Community Survey 2015 5-Year survey: percent of adults now married, percent of non-white population, percent under the poverty line, and median income. The non-white population in each city was calculated as 100 percent minus the percent of the white only population.
Cities were ordered based on the age-adjusted mean percent of the population that has seen their physician for an annual physical within the last year. Simple ordinary least squares regression and pearson correlation analysis were conducted to determine whether a statistically significant trend occurred between the number of doctor visits and the variable of interest. Only the ten cities with the lowest percentage of its residents going to the doctor in 2015 are included.
Haven Life Insurance Agency LLC (Haven Life) conducted this analysis for educational/ informational purposes only. Haven Life is an online life insurance agency offering term life insurance issued by Massachusetts Mutual Life Insurance Company. Haven Life does not provide tax, legal, investment, or housing/real estate advice, and Haven Life’s analysis of the information in the study should not be relied on as such. You should consult your own tax, legal, investment, and other advisors, as appropriate, before engaging in any transaction.
More From Talk Radio 960 AM